Who Are the Top Robot Integrators Worldwide?

Who Are the Top Robot Integrators Worldwide? This question requires more than a simple revenue ranking. Robot integrators design, install, program, and validate complete automation cells. Their work connects robotic arms with vision systems, conveyors, safety equipment, and production software. A polished machine is only the visible layer.

The International Federation of Robotics reported 541,302 industrial robots installed worldwide in 2023. Its World Robotics 2024 report also recorded more than 4.28 million robots operating globally. These figures show strong demand, but they do not identify the best integrators by themselves. Performance depends on uptime, commissioning speed, engineering depth, cybersecurity, and after-sales support. Interact Analysis and ARC Advisory Group reports also highlight growing investment in smart manufacturing, machine vision, and software-connected automation. The market is expanding unevenly. Regional expertise still matters.

Marina Bill, President of the International Federation of Robotics, has described automation as “not only a trend, but a strategic necessity for businesses to remain competitive.” That view explains why leading robot integrators increasingly act as long-term manufacturing partners. They do not merely sell robots. They reduce cycle times, stabilize quality, and help operators manage complex cells.

Still, rankings can be imperfect. Many integrators are privately owned, and their revenue figures are not fully comparable. Some specialize in automotive welding, while others focus on packaging, logistics, or electronics. This guide therefore considers global reach, technical capability, documented projects, partner ecosystems, and customer outcomes. The strongest names may not always be the largest. Reliability leaves evidence on the factory floor.
Who Are the Top Robot Integrators Worldwide?

Defining Robot Integrators Through IFR’s 541,000+ Robot Installations in 2023

Who Are the Top Robot Integrators Worldwide?

Robot integrators should not be ranked by robot volume alone. The International Federation of Robotics reported 541,302 industrial robot installations worldwide in 2023. This figure measures deployed robots, not individual integrator performance. It still offers a useful market lens. Asia represented roughly 70% of global installations, while Europe and the Americas followed at much smaller shares. Integrators serving automotive, electronics, logistics, and metalworking plants therefore operate in very different conditions.

A strong integrator connects the robot, tooling, sensors, safety controls, software, and production data. On a factory floor, this means reducing cycle-time variation, protecting operators, and making maintenance practical. IFR’s World Robotics 2024 report also recorded more than four million industrial robots operating worldwide. That installed base creates demand for upgrades, line balancing, and lifecycle support. However, installation volume does not prove project quality. A small integrator may deliver better uptime than a larger one. That is easy to overlook.

Tips: Compare acceptance-test results, mean time between failures, training depth, and local service coverage. Ask for evidence from similar processes. Do not rely on shipment numbers alone.

A useful evaluation should combine IFR installation data with project-level evidence. Interact Analysis also emphasizes the importance of automation investment, regional manufacturing trends, and application demand. The harder question remains unresolved: who delivers the most reliable production outcome, not merely the most installations?

Global Leaders: FANUC, ABB, KUKA, Yaskawa, Comau, and JR Automation

The world’s leading robot integrators are no longer judged by hardware alone. They design complete production systems, including robot cells, vision, safety controls, software, and after-sales support. The six global leaders highlighted in this market represent strong capabilities across Japanese, European, and North American manufacturing networks.

The International Federation of Robotics reported 541,302 industrial robots installed worldwide in 2023. The global operational stock reached about 4.28 million units. These figures show why integration expertise matters.

A robot arm may move quickly, but poor fixture design can create costly pauses. Experienced integrators study cycle time, operator access, maintenance routes, and factory data before selecting equipment. Small details matter.

Their strongest projects often serve automotive, electronics, logistics, food, and metalworking plants. They connect robotic welding, palletizing, assembly, inspection, and digital monitoring into one controlled workflow.

IFR also identified Asia as the largest regional market, accounting for roughly 70% of new installations in 2023. That concentration raises the value of local engineering teams and multilingual service coverage.

Yet scale does not guarantee a perfect result. Some projects still underestimate training, spare parts, or software ownership. That is a real weakness.

Buyers should compare documented uptime, recovery procedures, integration standards, and safety validation, rather than relying on reputation alone. The best global integrator is the one that can prove stable performance on the factory floor.

Regional Scale: China Represented 51% of 2023 Installations, IFR Reports

China represented 51% of global robot installations in 2023, according to the International Federation of Robotics. That figure reshapes any discussion about the world’s top robot integrators. Regional scale now matters as much as technical design.

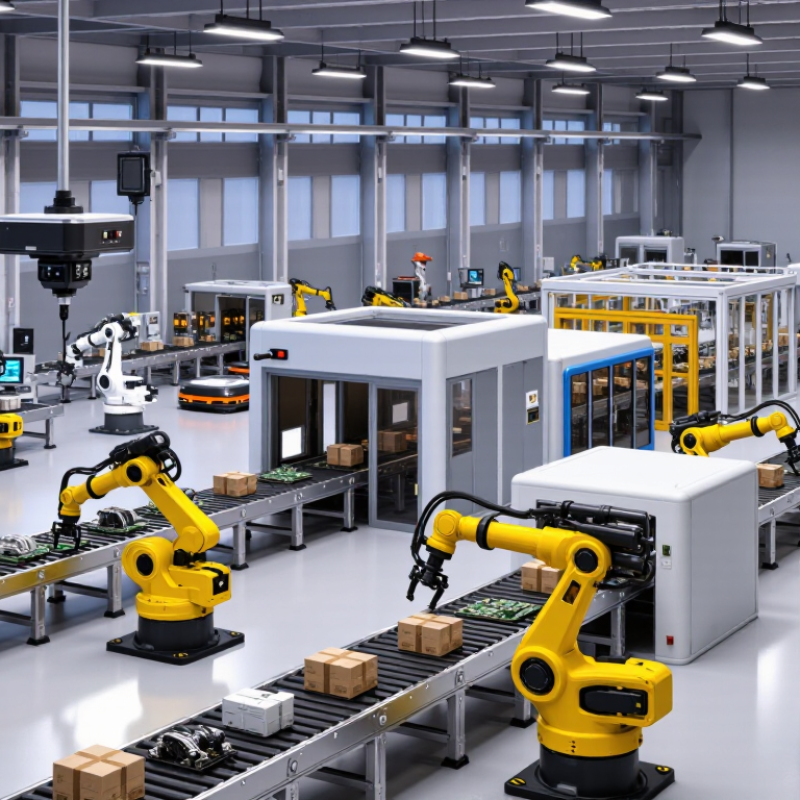
In practical deployments, leading integrators must manage high-volume factory projects across welding, assembly, packaging, and material handling. A typical cell may include robotic arms, vision systems, grippers, conveyors, safety barriers, and production software. Success depends on more than installation speed. Engineers must test cycle times, positioning accuracy, operator access, and maintenance procedures on the shop floor.

China’s large installation base creates strong demand for local engineering capacity and responsive service teams. However, installation volume does not automatically prove superior integration quality. IFR statistics measure robot installations, not project reliability, energy use, or long-term output. That distinction deserves attention.

A factory can install hundreds of robots and still face delays caused by weak data exchange or poor training. Small calibration errors may produce hours of downtime. Experienced integrators therefore document acceptance tests, spare-part plans, and safety checks before handover. The process is not perfect. Even well-planned projects can require redesign after real operators expose practical problems.

Who Are the Top Robot Integrators Worldwide? - Regional Scale: China Represented 51% of 2023 Installations, IFR Reports
Market or Region Industrial Robot Installations in 2023 Regional Scale Indicator Data Context
China 276,288 Largest national market worldwide China accounted for more than half of all industrial robot installations recorded globally in 2023.
Asia Approximately 382,000 Largest regional market Asia remained the dominant destination for industrial robot installations, with China representing the largest portion of regional demand.
Europe Approximately 92,000 Second-largest regional market Europe maintained a substantial installed-robot market, although installations declined compared with the exceptionally strong prior year.
Americas Approximately 55,000 Third-largest regional market The Americas represented a smaller share of global installations than Asia and Europe in 2023.
Other markets Approximately 12,000 Emerging and smaller deployment markets This residual category represents installations outside the principal regional groupings reported above.
Worldwide total 541,302 Record global deployment scale The global total covers new industrial robot installations recorded worldwide during 2023.
Source: International Federation of Robotics (IFR), World Robotics 2024. Regional figures marked “approximately” are rounded values reported by the IFR; percentages are calculated against the worldwide total of 541,302 installations. The table measures robot installations by market and does not rank individual integrator companies or brands.

Sector Strength: Automotive, Electronics, Logistics, and Metalworking Systems

Who Are the Top Robot Integrators Worldwide?

Sector Strength: Automotive, Electronics, Logistics, and Metalworking Systems

The world’s leading robot integrators are not defined by hardware alone. They combine process engineering, controls expertise, safety planning, and dependable after-sales support. Their strongest projects begin with a detailed study of cycle time, product variation, operator movement, and maintenance access. This practical approach reduces costly surprises during commissioning.

Automotive systems often require welding, painting, fastening, and precise material handling. Electronics projects demand cleaner environments, gentle gripping, vision inspection, and strict traceability. In logistics, integrators connect robots with conveyors, storage systems, scanners, and warehouse software. Metalworking applications need durable cells for cutting, loading, polishing, and machine tending. Heat, dust, vibration, and sharp edges expose weak designs quickly.

Sector experience matters.

Reliable integrators test real parts before final installation. They document safety functions, train local technicians, and measure performance after startup. Yet no integrator is equally strong in every industry. A polished demonstration may hide difficult maintenance conditions or limited software flexibility. Buyers should examine reference projects, spare-parts planning, response times, and long-term data access. The best choice is often the team that asks uncomfortable questions early. That habit can prevent an impressive system from becoming an expensive problem.

Benchmarking Integrators Against IFR’s 4.28 Million Operational Robots

The global robot integration market is best judged against scale, not publicity. IFR reports 4.28 million operational industrial robots worldwide, a useful benchmark for context. That figure represents machines running in factories, not integrators alone. Still, it shows the environment top integrators must support. Their value appears in deployment quality, uptime, safety validation, and repeatable commissioning. Strong teams connect robots with vision, conveyors, tooling, controls, and production data. They also document changes clearly. That matters during audits and maintenance.

A credible worldwide comparison should examine completed systems, regional service coverage, engineering depth, and lifecycle support. Ask how many cells operate after twelve months, not how many were sold. Evidence matters. Integrators should provide acceptance records, fault histories, training plans, and measurable cycle-time results. The comparison is imperfect, though. Public data often mixes robot suppliers, system builders, and software specialists. Some reports count installations differently. A small expert team may outperform a larger provider in a difficult process. That caveat deserves attention.

Tips: Use IFR’s 4.28 million figure as a market baseline, then score integrators by verified outcomes. Request site references with similar payloads, takt times, and working conditions. Check spare-parts response and remote support. Visit a live cell if possible. Do not accept a polished demo as proof. Real factories are louder, dirtier, and less predictable. Leave room for redesign; early assumptions are often wrong.