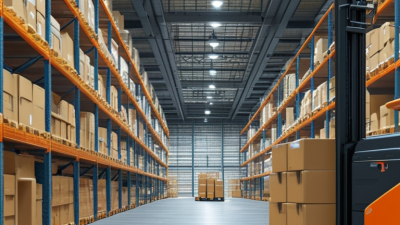
2026 Top Warehouse Automation Systems for Global Buyers
In 2026, warehouse automation is no longer limited to massive fulfillment centers. Global buyers now assess robotic picking, automated storage and retrieval systems, conveyor networks, and warehouse management software together. The right system must fit real operating conditions, not just a supplier’s presentation.
MHI President and CEO John Paxton has described the broader direction: “The future of supply chains is digital, connected, and automated.” His point matters for buyers comparing systems across regions. A solution may perform well in a high-volume facility but struggle with uneven floors, unstable internet, seasonal labor, or mixed product sizes. Small details decide large investments.
Performance is only one measure. Buyers should examine installation support, spare-parts access, software integration, cybersecurity, worker training, energy consumption, and measurable payback. Ask for reference sites with similar order profiles. Watch the robots operate. Check how quickly staff recover from a jam.
The numbers can be persuasive.
Still, forecasts are not guarantees. Some projects underestimate data preparation and change-management work. Others automate poor processes and make them faster. That is an uncomfortable lesson, but an important one.
This guide introduces leading warehouse automation systems for global buyers in 2026. It compares capabilities, operating requirements, scalability, supplier support, and practical limitations. The goal is not to name one universal winner. It is to help decision-makers choose technology that remains reliable after the demonstration ends, when pallets arrive late, orders spike, and the warehouse gets messy.
Warehouse Automation Explained: AS/RS, AMRs, WES, and Sortation
2026 Top Warehouse Automation Systems for Global Buyers
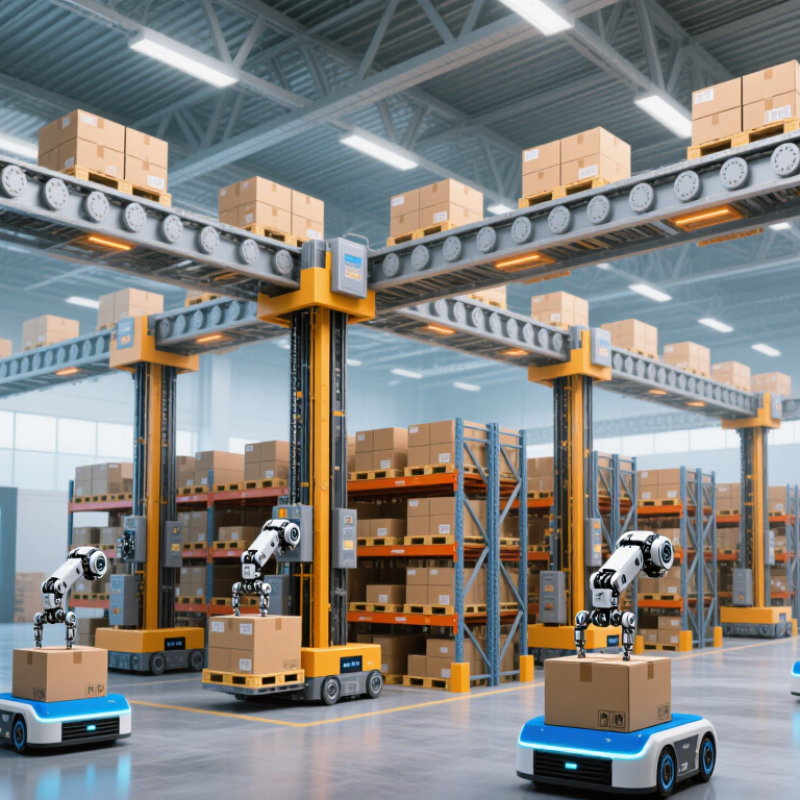
Warehouse automation now depends on coordinated systems, not isolated machines. AS/RS stores pallets or cartons in dense vertical locations, reducing travel across long aisles. AMRs move totes between receiving, storage, picking, and packing zones. WES connects these workflows, balancing labor, inventory, and equipment in real time. Sortation systems then direct parcels by destination, carrier, or order priority. The 2024 MHI Annual Industry Report found that 55% of supply chain leaders planned to increase technology investment within two years. That pressure is visible on warehouse floors.
Each system solves a different operational problem. AS/RS suits stable, high-volume inventory, but poor slotting can create expensive congestion. AMRs improve flexibility, although charging, traffic rules, and exception handling need careful planning. WES can raise orchestration quality, yet weak inventory data may simply make errors move faster. According to the 2024 World Robotics report, global factory robot installations reached 541,302 units in 2023. This figure is not a warehouse metric, but it signals broader confidence in automated material movement. Buyers should still question whether a projected return depends on perfect forecasts. Real facilities rarely behave perfectly.
Tips: Map one complete order journey before selecting equipment. Measure touches, walking distance, peak-hour volume, and failed scans. Test mixed-SKU orders and urgent replenishment. Ask for recovery procedures, integration limits, service response times, and local training. A small pilot may reveal more than a polished simulation. Also compare energy use, maintenance access, and workforce safety requirements across operating regions.
2026 Market Demand: MHI Reports 83% Plan to Increase Automation Investment
2026 Top Warehouse Automation Systems for Global Buyers
MHI reports that 83% of surveyed organizations plan to increase automation investment in 2026. This figure reflects growing pressure on warehouses worldwide. Labor shortages, faster delivery expectations, and rising order volumes are changing purchasing decisions. Buyers now examine complete systems, not isolated machines.
A modern warehouse may combine automated storage, conveyor lines, mobile robots, robotic picking, and warehouse management software. Each system serves a different operational need. High-density storage can reduce walking time. Mobile robots can move cartons between picking zones and packing stations. Vision systems can check labels, dimensions, and damaged packaging. In cold storage, equipment must also tolerate low temperatures and condensation.
Integration remains the difficult part. Fast machines cannot fix poor inventory data. A barcode mismatch may stop an entire packing lane. Global buyers should review maintenance access, spare-part availability, training, cybersecurity, and local service support. Total cost includes installation, software updates, energy use, and downtime.
The 83% investment plan is encouraging, but it should not drive rushed purchasing. Every facility has different ceilings, floor strength, product sizes, and peak seasons. Pilot testing can expose hidden delays before a full rollout. Payback estimates may also look too optimistic when demand changes. That deserves scrutiny. Reliable results usually come from measured throughput, realistic labor assumptions, and clear performance records over time.
2026 Top Warehouse Automation Systems for Global Buyers
Market demand signal: 83% of surveyed supply-chain leaders plan to increase investment in automation.
The result indicates strong buyer demand for warehouse automation systems, including automated storage and retrieval, goods-to-person picking, autonomous mobile robots, conveyor systems, and warehouse control software. Source: MHI Annual Industry Report industry survey.
How to Compare Systems: Throughput, Accuracy, Labor, and Total Cost
Global buyers evaluating 2026 warehouse automation systems should begin with measurable operating conditions. Throughput means more than advertised orders per hour. Measure completed lines during receiving, picking, packing, and replenishment. Record results during peak shifts, not only controlled demonstrations. A system handling 8,000 items hourly may slow sharply when product sizes vary. That difference matters.
Accuracy requires practical testing. Use mixed cartons, damaged labels, awkward packaging, and frequent stock changes. Track mispicks, inventory mismatches, scanning errors, and recovery time. One small mistake can delay an entire customer order. Set a clear target, such as 99.8% picking accuracy, then verify it independently. Perfect numbers deserve skepticism.
Labor analysis should include training, supervision, maintenance, and exception handling. Automation may reduce repetitive movement while creating technical roles. Calculate how many workers remain at each shift and what skills they need. Total cost includes equipment, software integration, installation, energy, repairs, upgrades, and downtime. Our early cost model was too optimistic because it ignored seasonal staffing and manual fallback work. Build a three-year scenario with low, expected, and peak volumes. Leave room for surprises.
| System Type | Primary Use Case | Typical Throughput | Inventory / Picking Accuracy | Potential Direct-Labor Reduction | Indicative Installed Capital Cost | Typical Payback Range | Best-Fit Operating Profile |
|---|---|---|---|---|---|---|---|
| Conveyor and Sortation System | High-volume carton, tote, and parcel movement with routing to packing or shipping lanes. | 1,500–10,000 items/hour Per system, depending on sorter and induction design. |
99.5%–99.9% When barcode scanning and process controls are properly implemented. |
15%–35% Most effective for transport, accumulation, and sortation tasks. |
US$1.5M–US$10M+ Large variation based on conveyor length, sorter type, controls, and building work. |
2–5 years | Stable layouts, predictable flows, high order volume, and facilities with sufficient floor space. |
| Autonomous Mobile Robot Goods-to-Person System | Robots bring storage shelves, racks, or containers to stationary picking and replenishment stations. | 100–600 order lines/hour per station Site-level capacity scales with the number of stations and robots. |
99.5%–99.9% Station-directed picking can reduce walking and selection errors. |
30%–60% Compared with manual shelf-to-person picking in suitable operations. |
US$2M–US$15M+ Usually includes robots, racks, charging, stations, software, and integration. |
2.5–5 years | Large SKU counts, variable demand, e-commerce or omnichannel order profiles, and leased facilities requiring flexibility. |
| Shuttle-Based Tote or Carton AS/RS | Dense storage and automated retrieval of totes, cartons, or small cases for goods-to-person fulfillment. | 300–1,200 totes/hour per aisle Multi-aisle systems can exceed this range. |
99.7%–99.95% High repeatability with controlled storage locations and scanning. |
40%–70% Often reduces travel, replenishment, and retrieval labor. |
US$4M–US$25M+ Dependent on storage height, aisle count, lifts, stations, and fire protection. |
3–7 years | High-density facilities with moderate-to-high order volume and a relatively stable storage footprint. |
| Mini-Load Crane AS/RS | Automated storage and retrieval of totes, trays, cartons, and small parts in high-bay structures. | 100–400 storage/retrieval cycles/hour per crane | 99.7%–99.95% Performance depends on item identification, slotting, and system controls. |
35%–65% Particularly effective where manual travel and retrieval distances are high. |
US$3M–US$20M+ | 4–8 years | High-density storage, consistent unit loads, constrained floor area, and long-term ownership plans. |
| Pallet AS/RS | Automated storage, buffering, sequencing, and retrieval of full pallets. | 20–60 pallet movements/hour per crane | 99.5%–99.9% Subject to pallet quality, load stability, and identification controls. |
30%–60% Can reduce forklift travel, traffic, and repetitive pallet-handling work. |
US$5M–US$30M+ | 4–9 years | Manufacturing, food and beverage, retail distribution, and operations requiring high storage density or cold-room efficiency. |
| Autonomous Forklift or Pallet-Moving Robot | Automated pallet transport between receiving, storage, production, staging, and shipping areas. | 10–30 pallet moves/hour per vehicle Actual output varies with travel distance and traffic rules. |
99.0%–99.8% Requires reliable pallet detection, location control, and exception handling. |
20%–50% Usually supplements rather than fully replaces warehouse labor. |
US$250,000–US$1.5M+ For a multi-vehicle deployment including software, charging, and integration. |
2–6 years | Repetitive pallet routes, labor shortages, mixed human-machine environments, and facilities with limited infrastructure changes. |
| Robotic Piece-Picking Cell | Automated picking of individual items from totes or bins for order consolidation and packing. | 400–1,200 picks/hour per cell Strongly influenced by item presentation and SKU variability. |
97%–99.5% pick success per attempt Exceptions may require human handling or a second attempt. |
20%–50% Highest potential for repetitive, presentation-friendly items. |
US$500,000–US$2M+ Includes robotic equipment, vision, gripping, safety, and integration. |
3–7 years | High-volume piece picking with stable demand, consistent item presentation, and a broad labor-cost gap. |
| Put-Wall and Automated Sort-to-Order System | Sorts picked items into order destinations for batch picking, e-commerce, and store replenishment. | 500–2,500 items/hour | 99.5%–99.9% Dependent on scanning, destination confirmation, and exception procedures. |
15%–40% Reduces manual order sorting and repeated walking. |
US$300,000–US$5M+ | 1.5–4 years | Many small orders, batch-picking operations, retail store fulfillment, and facilities seeking a moderate-cost automation step. |
| Automated Packing and Dimensioning Line | Carton selection, filling, sealing, weighing, dimensioning, labeling, and outbound verification. | 300–1,200 parcels/hour per line | 99.5%–99.9% For weight, dimensions, labels, and packing-rule compliance. |
20%–50% Can reduce packing stations and repetitive quality checks. |
US$750,000–US$8M+ | 2–5 years | Parcel-heavy operations with consistent carton standards, high shipping volume, and measurable packaging labor or material savings. |
| Cross-System Comparison Considerations | |||||||
| Total Cost of Ownership | Evaluate equipment, software, integration, construction, safety systems, maintenance, spare parts, energy, training, upgrades, and eventual replacement. | A lower purchase price does not necessarily mean a lower five- or ten-year cost. | For global projects, include taxes, import duties, currency exposure, local service coverage, and regional electrical or safety requirements. | ||||
| Throughput Measurement | Compare sustained hourly capacity rather than short-term peak speed. | Confirm whether the quoted rate includes induction, replenishment, picking, packing, quality checks, exceptions, and system downtime. | Model peak-day demand, seasonal surges, product mix, order-line distribution, and required service-level buffers. | ||||
| Accuracy Measurement | Separate inventory-record accuracy, location accuracy, pick accuracy, scan accuracy, and successful robotic grasp rate. | A system should be assessed using the buyer's actual SKU dimensions, weights, packaging, barcodes, and exception rates. | Require documented acceptance tests using representative products and realistic operating conditions. | ||||
| Implementation Risk | Review integration with warehouse management, warehouse control, enterprise resource planning, transportation, labor, and maintenance systems. | Assess site readiness, floor loading, ceiling height, fire protection, network resilience, and emergency access. | Prioritize modular designs when demand, product mix, facility ownership, or regional expansion plans are uncertain. | ||||
| Data basis and interpretation: The figures above are non-branded, indicative industry ranges intended for early-stage comparison. They represent typical planning values rather than guaranteed performance. Capital costs are shown in 2026 U.S. dollars and generally exclude land, major building expansion, financing costs, taxes, and unusually complex civil works. Labor-reduction estimates indicate potential reduction in direct handling or travel labor, not necessarily immediate headcount reduction. Payback depends on labor rates, utilization, operating hours, service levels, error costs, energy prices, and the proportion of demand that the automated system can process. | |||||||
2026 Top Systems: AS/RS, AMRs, Goods-to-Person, and Sortation
2026 Top Warehouse Automation Systems for Global Buyers
AS/RS, AMRs, goods-to-person stations, and sortation systems now shape warehouse investment decisions. The International Federation of Robotics reported 113,000 transportation and logistics robots sold globally in 2023, a 35% annual increase. That figure signals strong demand for AMRs, especially where labor availability changes by season or region. Still, moving robots through narrow aisles is not enough. Buyers should test battery charging, floor quality, network coverage, and human traffic during live shifts.
AS/RS offers dense storage and controlled inventory access. It suits facilities with high volumes, stable carton dimensions, and expensive floor space. Goods-to-person systems reduce walking by bringing bins or cases to operators.
The 2024 MHI Annual Industry Report identifies robotics and automation as a major investment priority among supply-chain organizations. Yet, goods-to-person designs can struggle with irregular items, damaged packaging, or frequent product changes. Small exceptions become expensive. Sometimes, a well-designed manual zone performs better.
Sortation systems add speed at receiving, picking, and shipping. They can separate cartons by destination, carrier, temperature requirement, or order profile. Buyers should compare peak throughput, not average hourly performance. A system rated for 6,000 items per hour may disappoint during mixed-item surges. Global buyers also need local service coverage, spare-parts access, cybersecurity controls, and integration testing. The numbers look impressive. The daily details decide whether the investment works.
Global Buyer Roadmap: Pilot, Integrate WMS/WES, Scale, and Measure ROI
A practical automation roadmap starts with a controlled pilot, not a warehouse-wide purchase. Map receiving, storage, picking, packing, and returns before selecting equipment. Record order volume, travel distance, error rates, labor hours, and peak-day delays. Then test one workflow, such as picking in a single zone. Keep the pilot small enough to observe every exception. Four to eight weeks can reveal more than a polished demonstration. In practice, the first design is rarely perfect.
Integration determines whether automation creates value or confusion. Confirm which tasks belong to the WMS and which belong to the WES. Define inventory ownership, order release rules, equipment signals, and recovery steps before installation. Use clean item data, barcode standards, and documented application interfaces. Run simulated orders before live cutover. A missed unit conversion can stop a conveyor. That detail is easy to underestimate.
Scale in stages, using evidence from the pilot. Add zones only after stability, operator training, and maintenance routines are proven. Track throughput, order accuracy, labor hours per order, uptime, energy use, and exception frequency. Calculate ROI with installation, integration, training, software, and downtime included. Payback may look attractive until hidden costs appear. Review results monthly with operations, finance, and technical teams. If performance improves but employees spend more time correcting exceptions, the system still needs redesign.
Related Posts
-
10 Warehouse Automation Tips for Global Buyers
-
Top Warehouse Automation Solutions for Global Buyers?
-
2026 How to Choose the Best AMR Robot for Your Business Needs?
-
Top 10 Differences Between AGV and AMR Technologies?
-
How to Choose the Right AMR Robot for Your Business Needs
-
10 AMR Automation Tips for Global Warehouse Buyers